
Choropleth
A choropleth map colors predefined areas according to a value. Population density by district, election results by constituency, rainfall by county.
It is the most common way to map statistics, and the cartography is easy to get wrong.
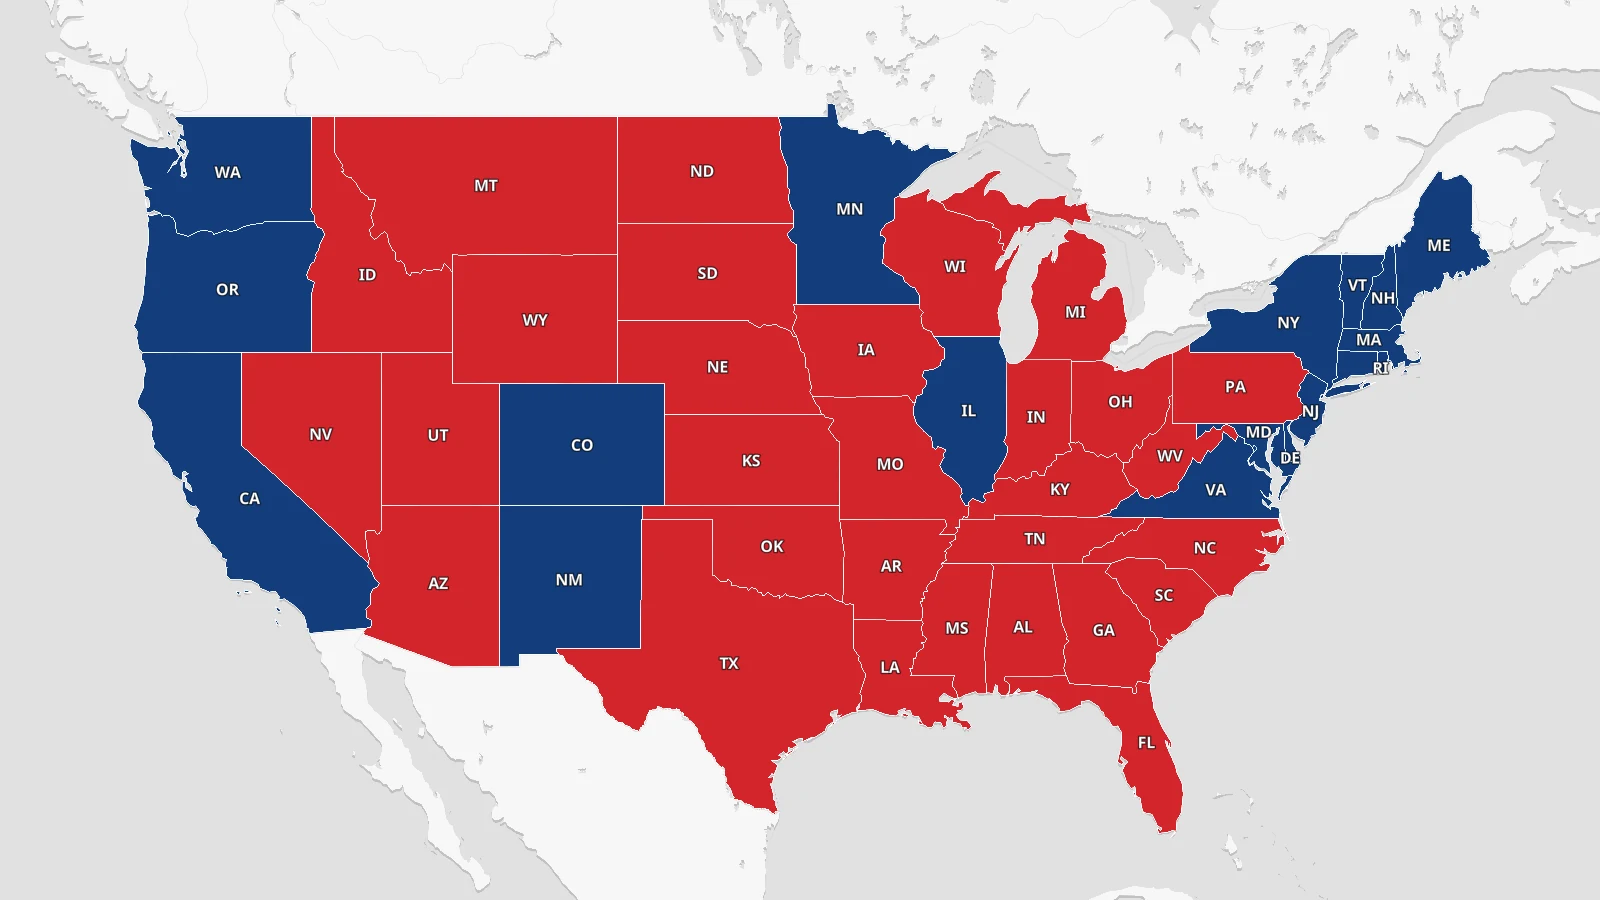
Mistakes in mapping choropleth
The usual mistake is mapping a count rather than a rate. Shading regions by total population mostly draws a map of which regions are large. Dividing by area or by population turns it into something the reader can actually compare.
Choropleth color schema
How you split the values into color bands changes the map more than the color scheme does. Equal intervals, quantiles, and natural breaks give three different pictures of the same data, so the choice is worth making on purpose and worth stating in the legend.
For a sequential value use a single hue that runs light to dark. Keep diverging schemes for data with a real midpoint, such as change above and below zero.
Building choropleth on a basemap
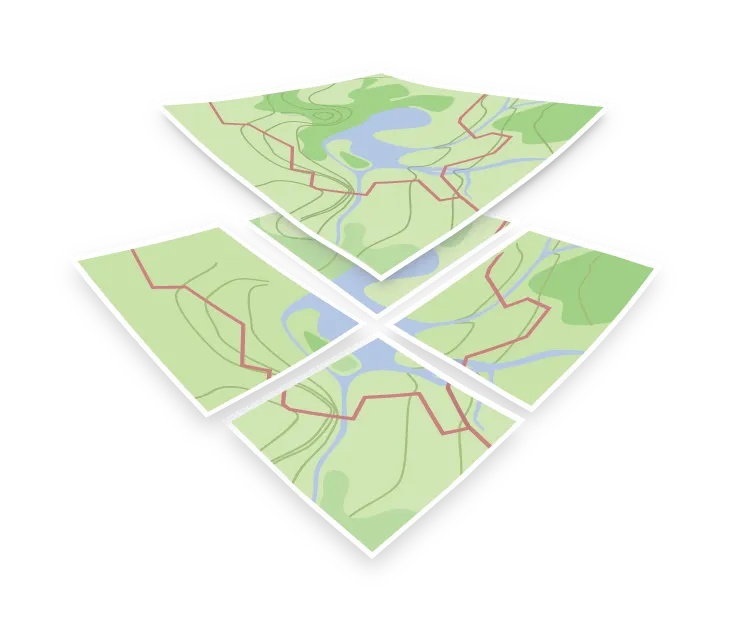
A choropleth is an overlay, not a basemap. The usual arrangement is a restrained basemap underneath, your polygons above it in a fill style layer shaded by value, and the basemap’s labels on top so place names stay readable.
This is a good reason to reach for a muted style. Positron and similar low-contrast designs exist precisely to sit under data without competing with it.